Google Data Studio

Interactive Data Visibility for Web Wellness

Know Your Web Health

It’s important to know where your company is heading.  It is equally as important to know where your company has been.  Giving you and your team significant insight into your business performance, Cazarin Interactive brings clarity to your web health with an interactive and customizable Google Data Studio dashboard built with custom analytical reporting that gives you quick access to the bigger picture.

Tracking eCommerce Growth

What You Need.  When You Need It

Growing your eCommerce business means understanding how your products are performing on your website and how your prospects are interacting with products on your website. With Cazarin’s custom eCommerce dashboard reporting, you can track:

 35
Last Month

Group-47@2x-129x129

Abandoned Carts

135
Last Month

secure-data-129x129

Orders

$156,750
Last Month

calendar-129x129

eCommerce sales

Great!

desktop-129x129

Campaign Performance

Tracking Web Growth

Providing reporting on lead quantity and quality

A critical part of growing your business is the leads you receive that eventually turn into customers and understanding the quality of each source and campaign. With Cazarin’s custom dashboard reporting, you can track:

26
Last Month

Group-47@2x-129x129

Forms submitted

37
Last Month

secure-data-129x129

Website phone tracking

63
Last Month

calendar-129x129

Total

desktop-129x129

Full Report

Analytics

Learn Which Web Pages Do Better

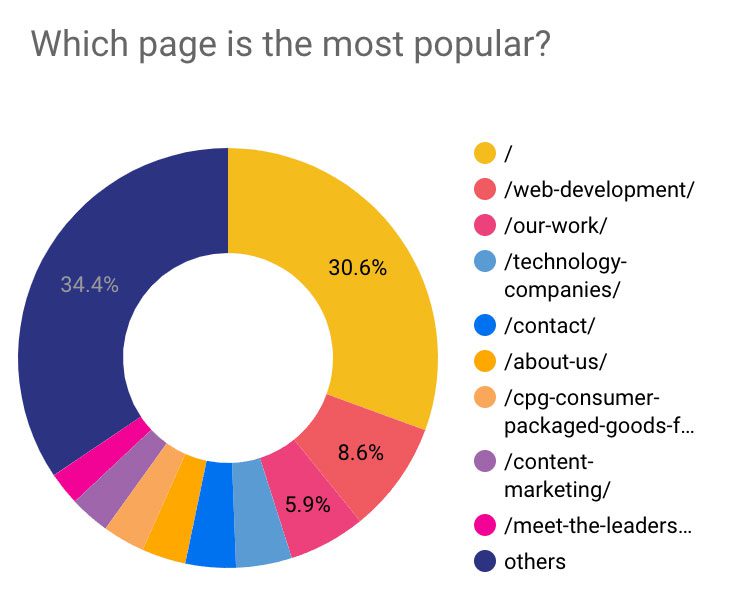
By discovering which of your web pages is the most popular, we gain insight into what is of most interest to your customers.  This is crucial when building out keyword-rich content, adding additional pages, or possibly scaling back on content that is not being accessed.

Keeping Your Web Presence Healthy

The Right Tools for Online Wellness

Just like annual physical and health checkups keep us humans on the right track, the Cazarin team ensures your web presence and online performance remains healthy.  We run technical SEO audits, track your SERP positions, analyze web traffic and uncover any keyword and backlink gaps.     

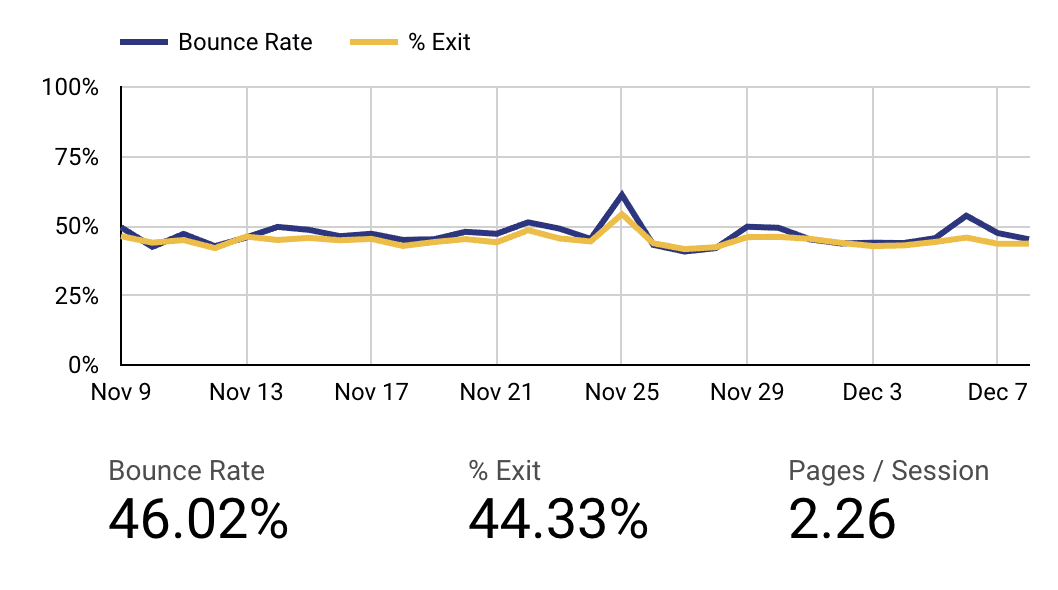
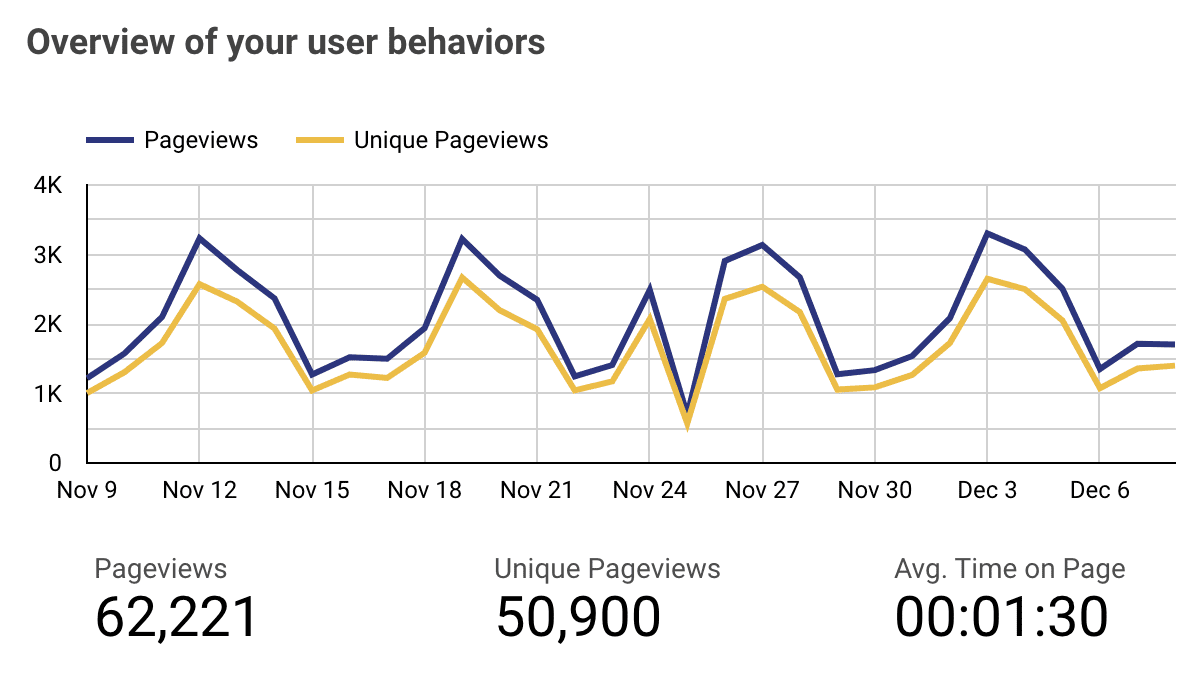
Keeping a check on user behavior patterns helps to understand the performance of the website and lets you see first-hand the bounce rate,  unique page views, and even the average amount of time spent on a specific page.

Analytics behavior
Analytics behavior
MarketingStateIMg

Cazarin’s Tool Box

The Fundamental Metrics to Grow Your Audience

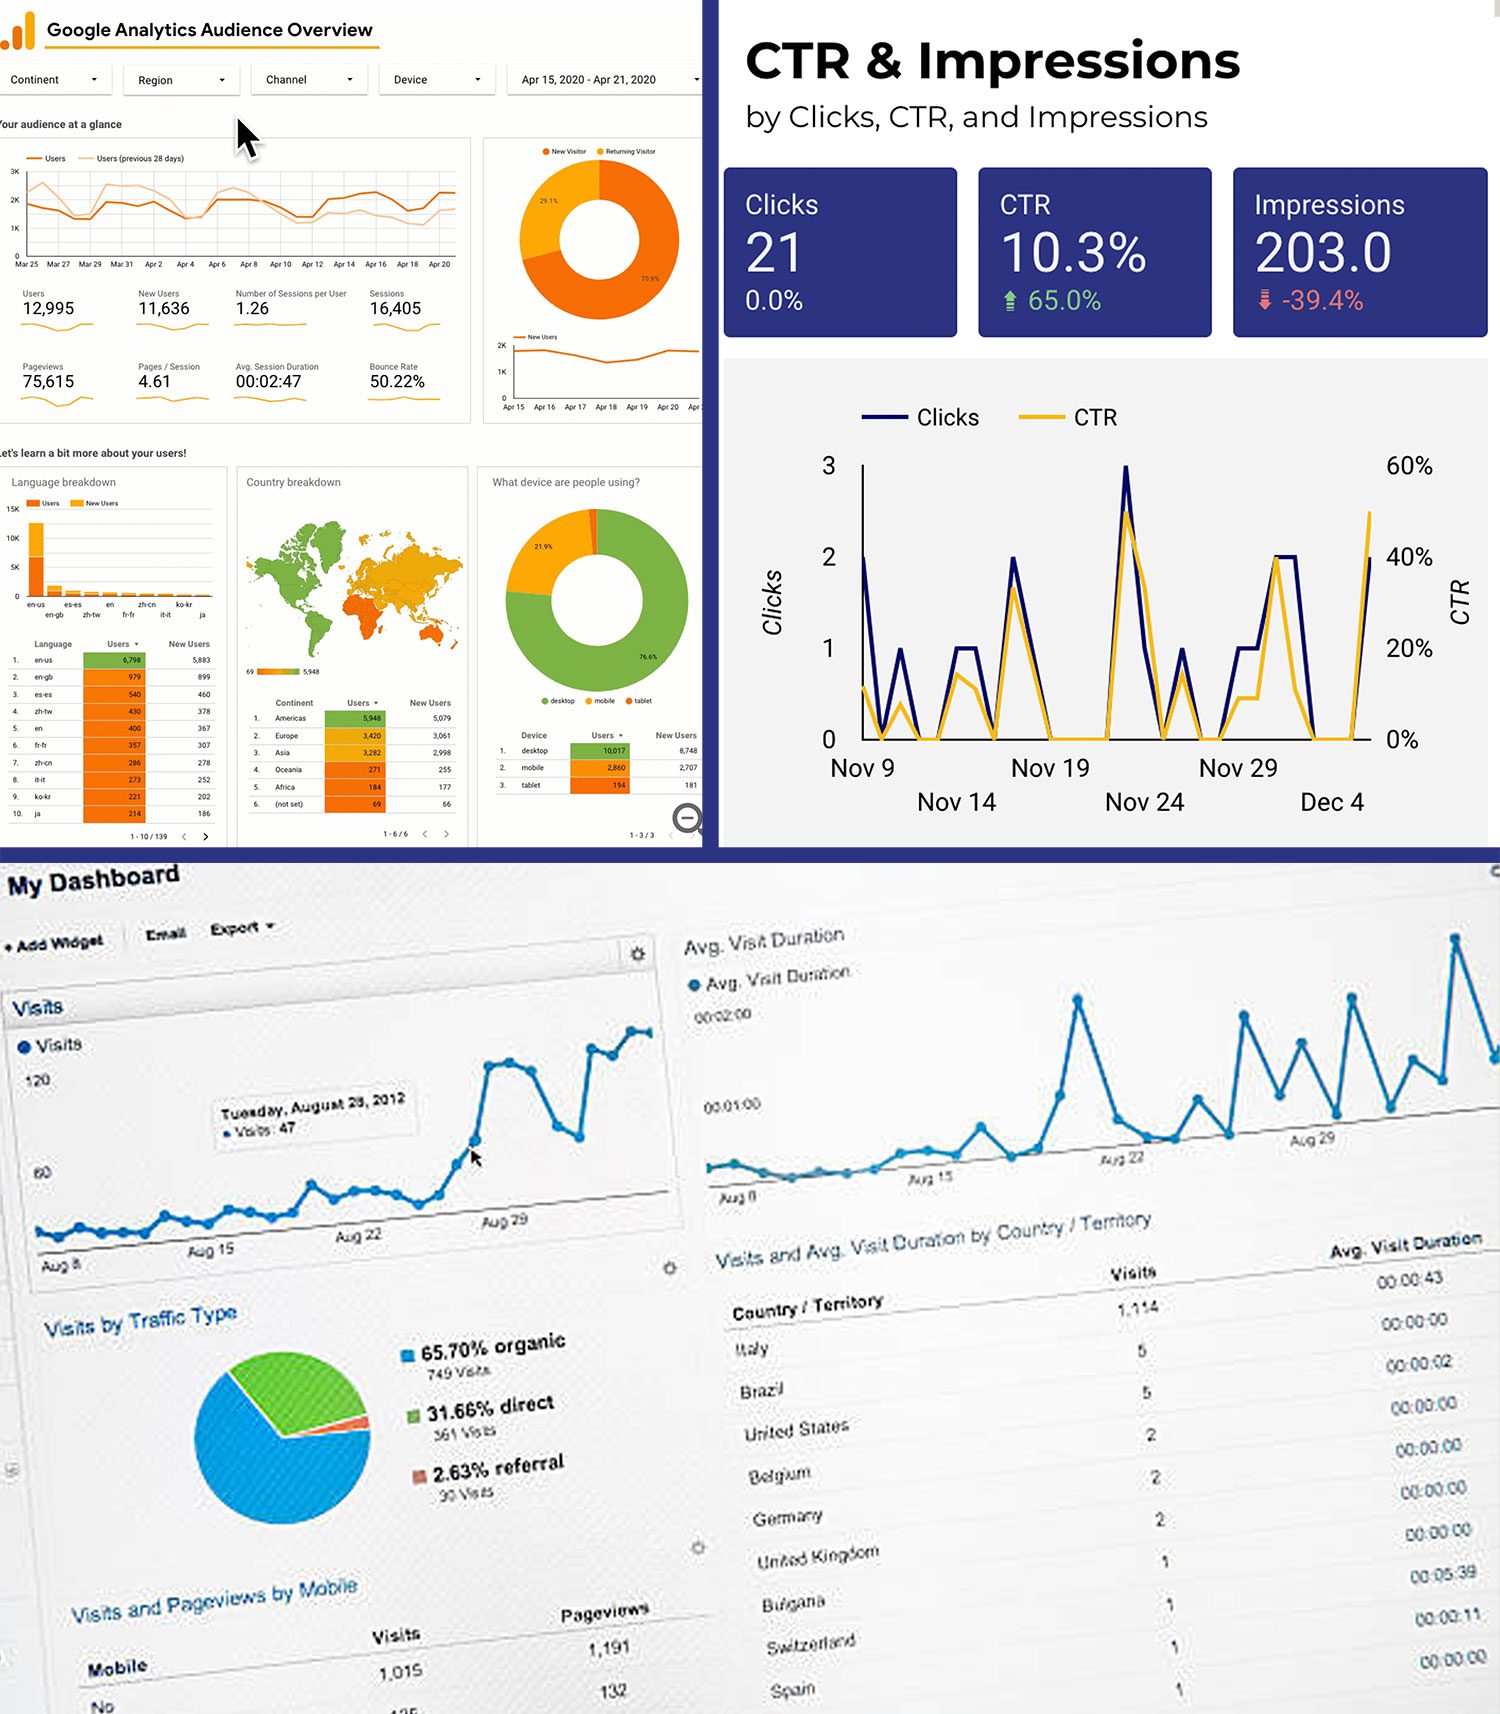
The first step in the Cazarin web wellness review is to assess your site’s search traffic and its routine performance.  While we make sure your site is prepared to take on every day with the best possible results, your custom dashboard will bring attention to any issue that pops up along the way.   Helping you grow your online audience faster,  the Cazarin tool box of metrics gives you visibility in your daily dashboard for:

  • Google Search Console
  • Google Analytics
  • Google Ads

Each tool gives you a variety of interactive reports that helps to monitor and maintain your web position and highlights areas that need attention.

Cazarin’s Tool Box PLUS

Deeper Visibility to More Analytics

Keeping your website healthy and ready to shine for every visitor is the key to a healthy web presence.  The Cazarin team goes far above the basic metrics and analytics and takes a deeper look into areas that can really impact your overall performance.

Together, we discover which metrics are most vital to your web and company health and create a custom dashboard built using custom analytical reporting specifically for you and your team.  For visibility into the areas that have a greater impact on your business growth, the Cazarin Tool Box PLUS deepens your dashboard and can include interactive reporting for:

  • Gravity Forms
  • Woo-Commerce
  • CallRail
  • Facebook Ads & Insights
  • LinkedIn Ads
  • LinkedIn Company
  • LinkedIn Prospecting
  • Instagram Ads & Insights
  • Google My Business
  • Amazon MWS
  • Hubspot
  • Shopify
  • YouTube Analytics

Reporting Your Way

At the click of a button, your reports are available as you need them. And since they’re interactive, you have the accessibility to create as many charts and graphs needed for the insight into your web performance. Reporting cadence is available:

networking-129x129

Weekly

system-129x129

Bi-weekly

calendar-129x129 (1)

Monthly

time-management-129x129

Annually

Executive Overview

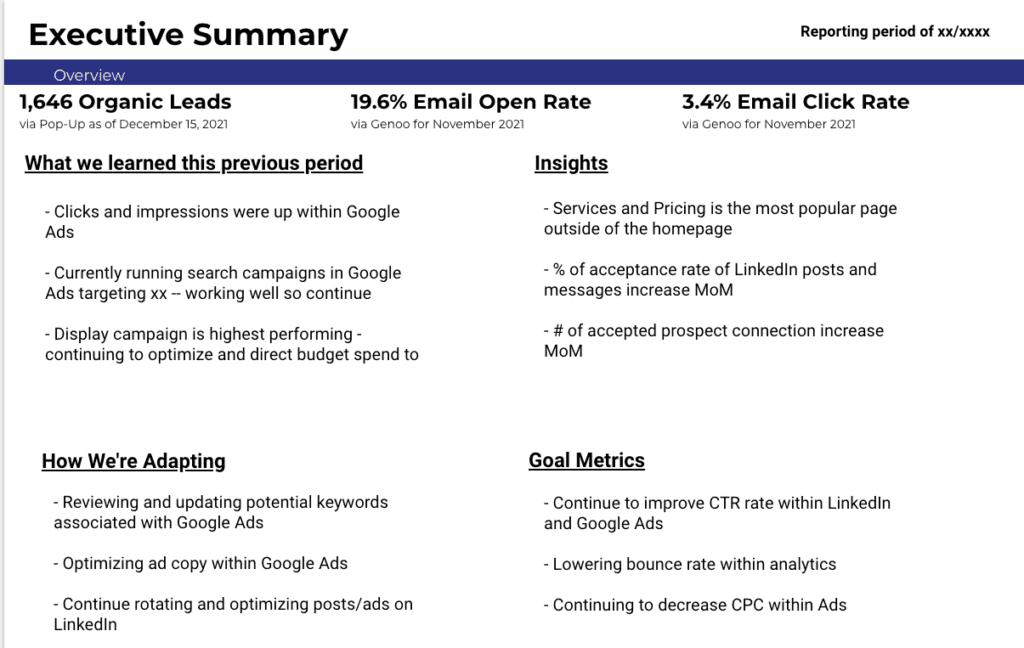
So now that you know what your metrics are, what do you do with that? The executive summary gives a customized review of your web performance and suggested steps and goals to take to increase your online activity for positive brand interaction and increased performance.
exe-summary

See How Cazarin Can Keep Your Web Presence Healthy

Sign Up to receive the latest resources

Sign Up to receive the latest resources

This field is for validation purposes and should be left unchanged.